Some Background
Honey, a high-value natural product prized for its unique sensory characteristics and health benefits, is one of the most frequently adulterated foods on the global market. The scale of the problem is staggering; a report1 by the European Commission in 2021-2022 found that 46% of imported honey samples were possibly adulterated with cheaper sweeteners, such as various sugar syrups.
Sagitto first became involved with honey analysis in 2015, when we applied machine learning2 to metabolomic data to create a set of unique biochemical ‘fingerprint’ markers to clearly distinguish nectars and honeys by floral type. High price differentials for monofloral honey such as manuka honey (as shown here) further increases the economic incentive for its adulteration.
In response to the worldwide threat of honey adulteration, a number of different analytical techniques have been developed for determining the floral origin of honey, and its potential adulteration. This blog post will discuss some of these.
Testing Honey Using NIR Spectroscopy
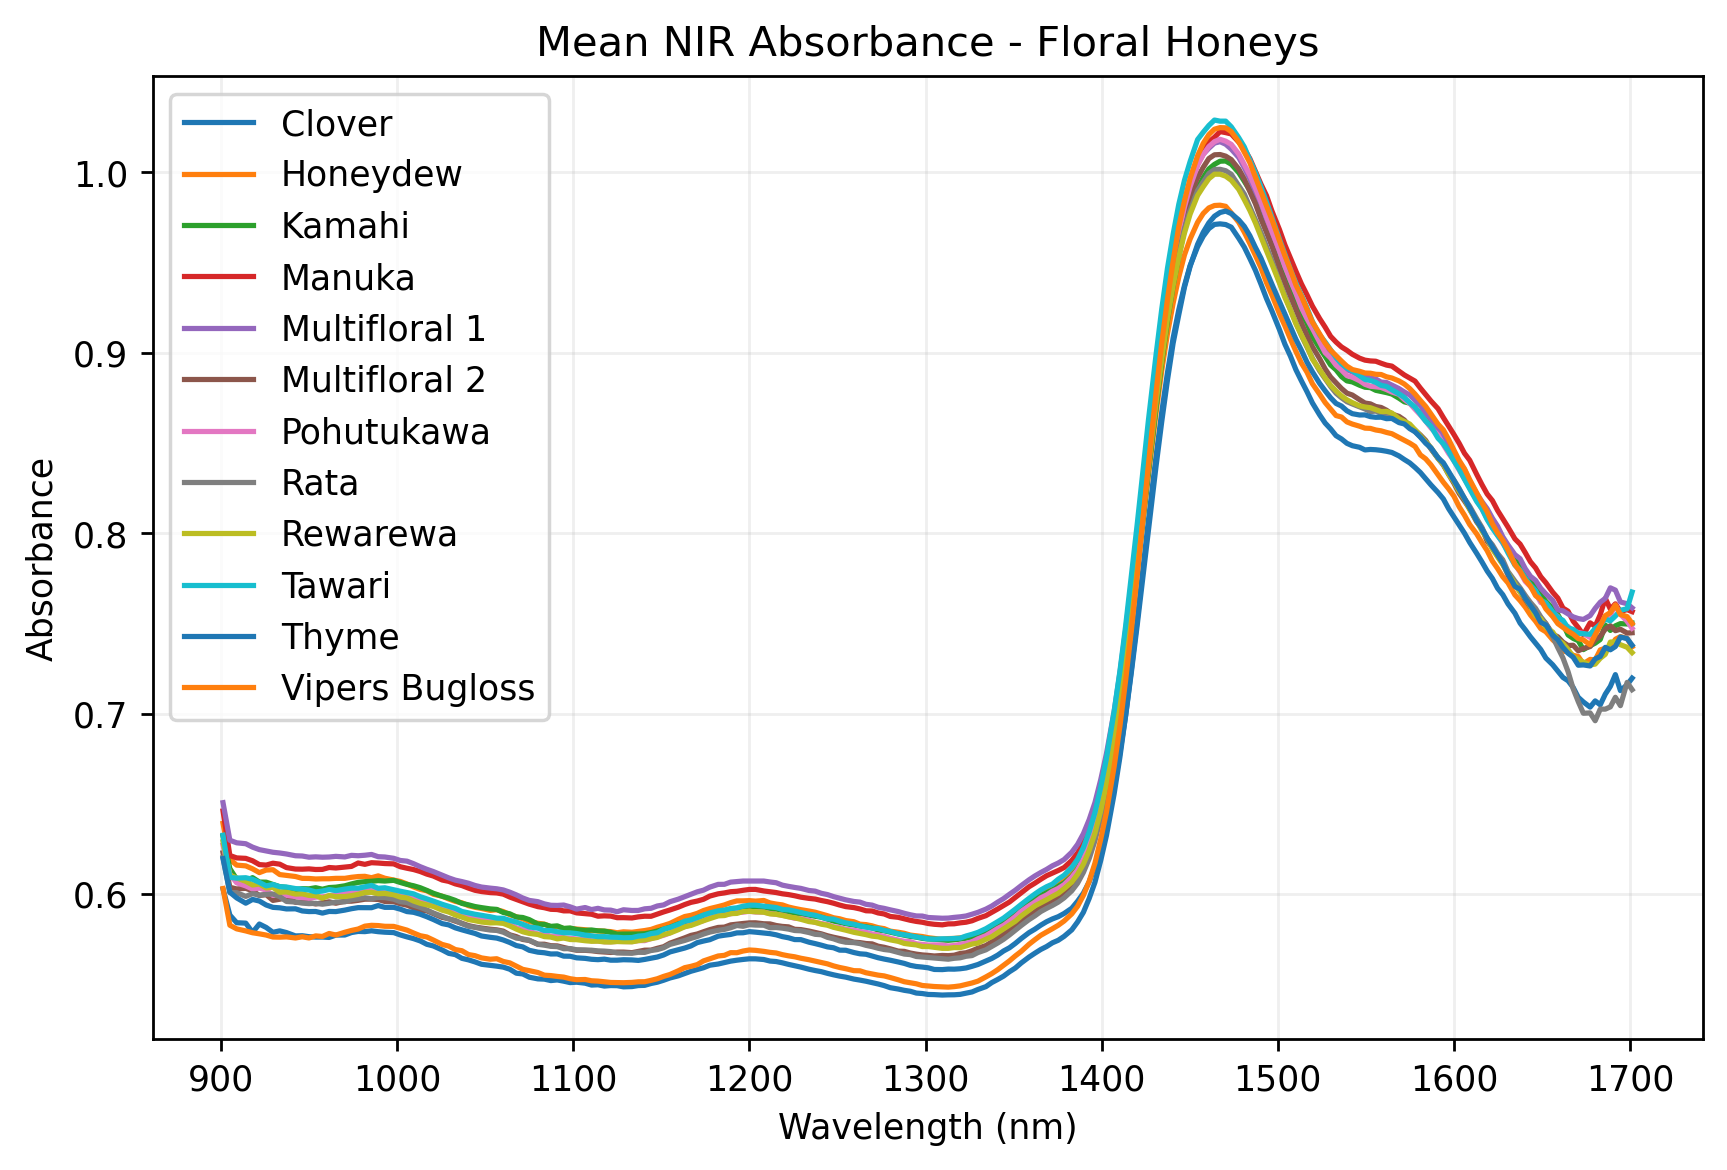
Near-Infrared (NIR) spectroscopy is a non-destructive analytical method that measures how much near-infrared light a sample absorbs. This absorption is related to the vibrational motion of molecules, particularly those with C-H, N-H, and O-H bonds, making it excellent for analyzing organic compounds such as honey.
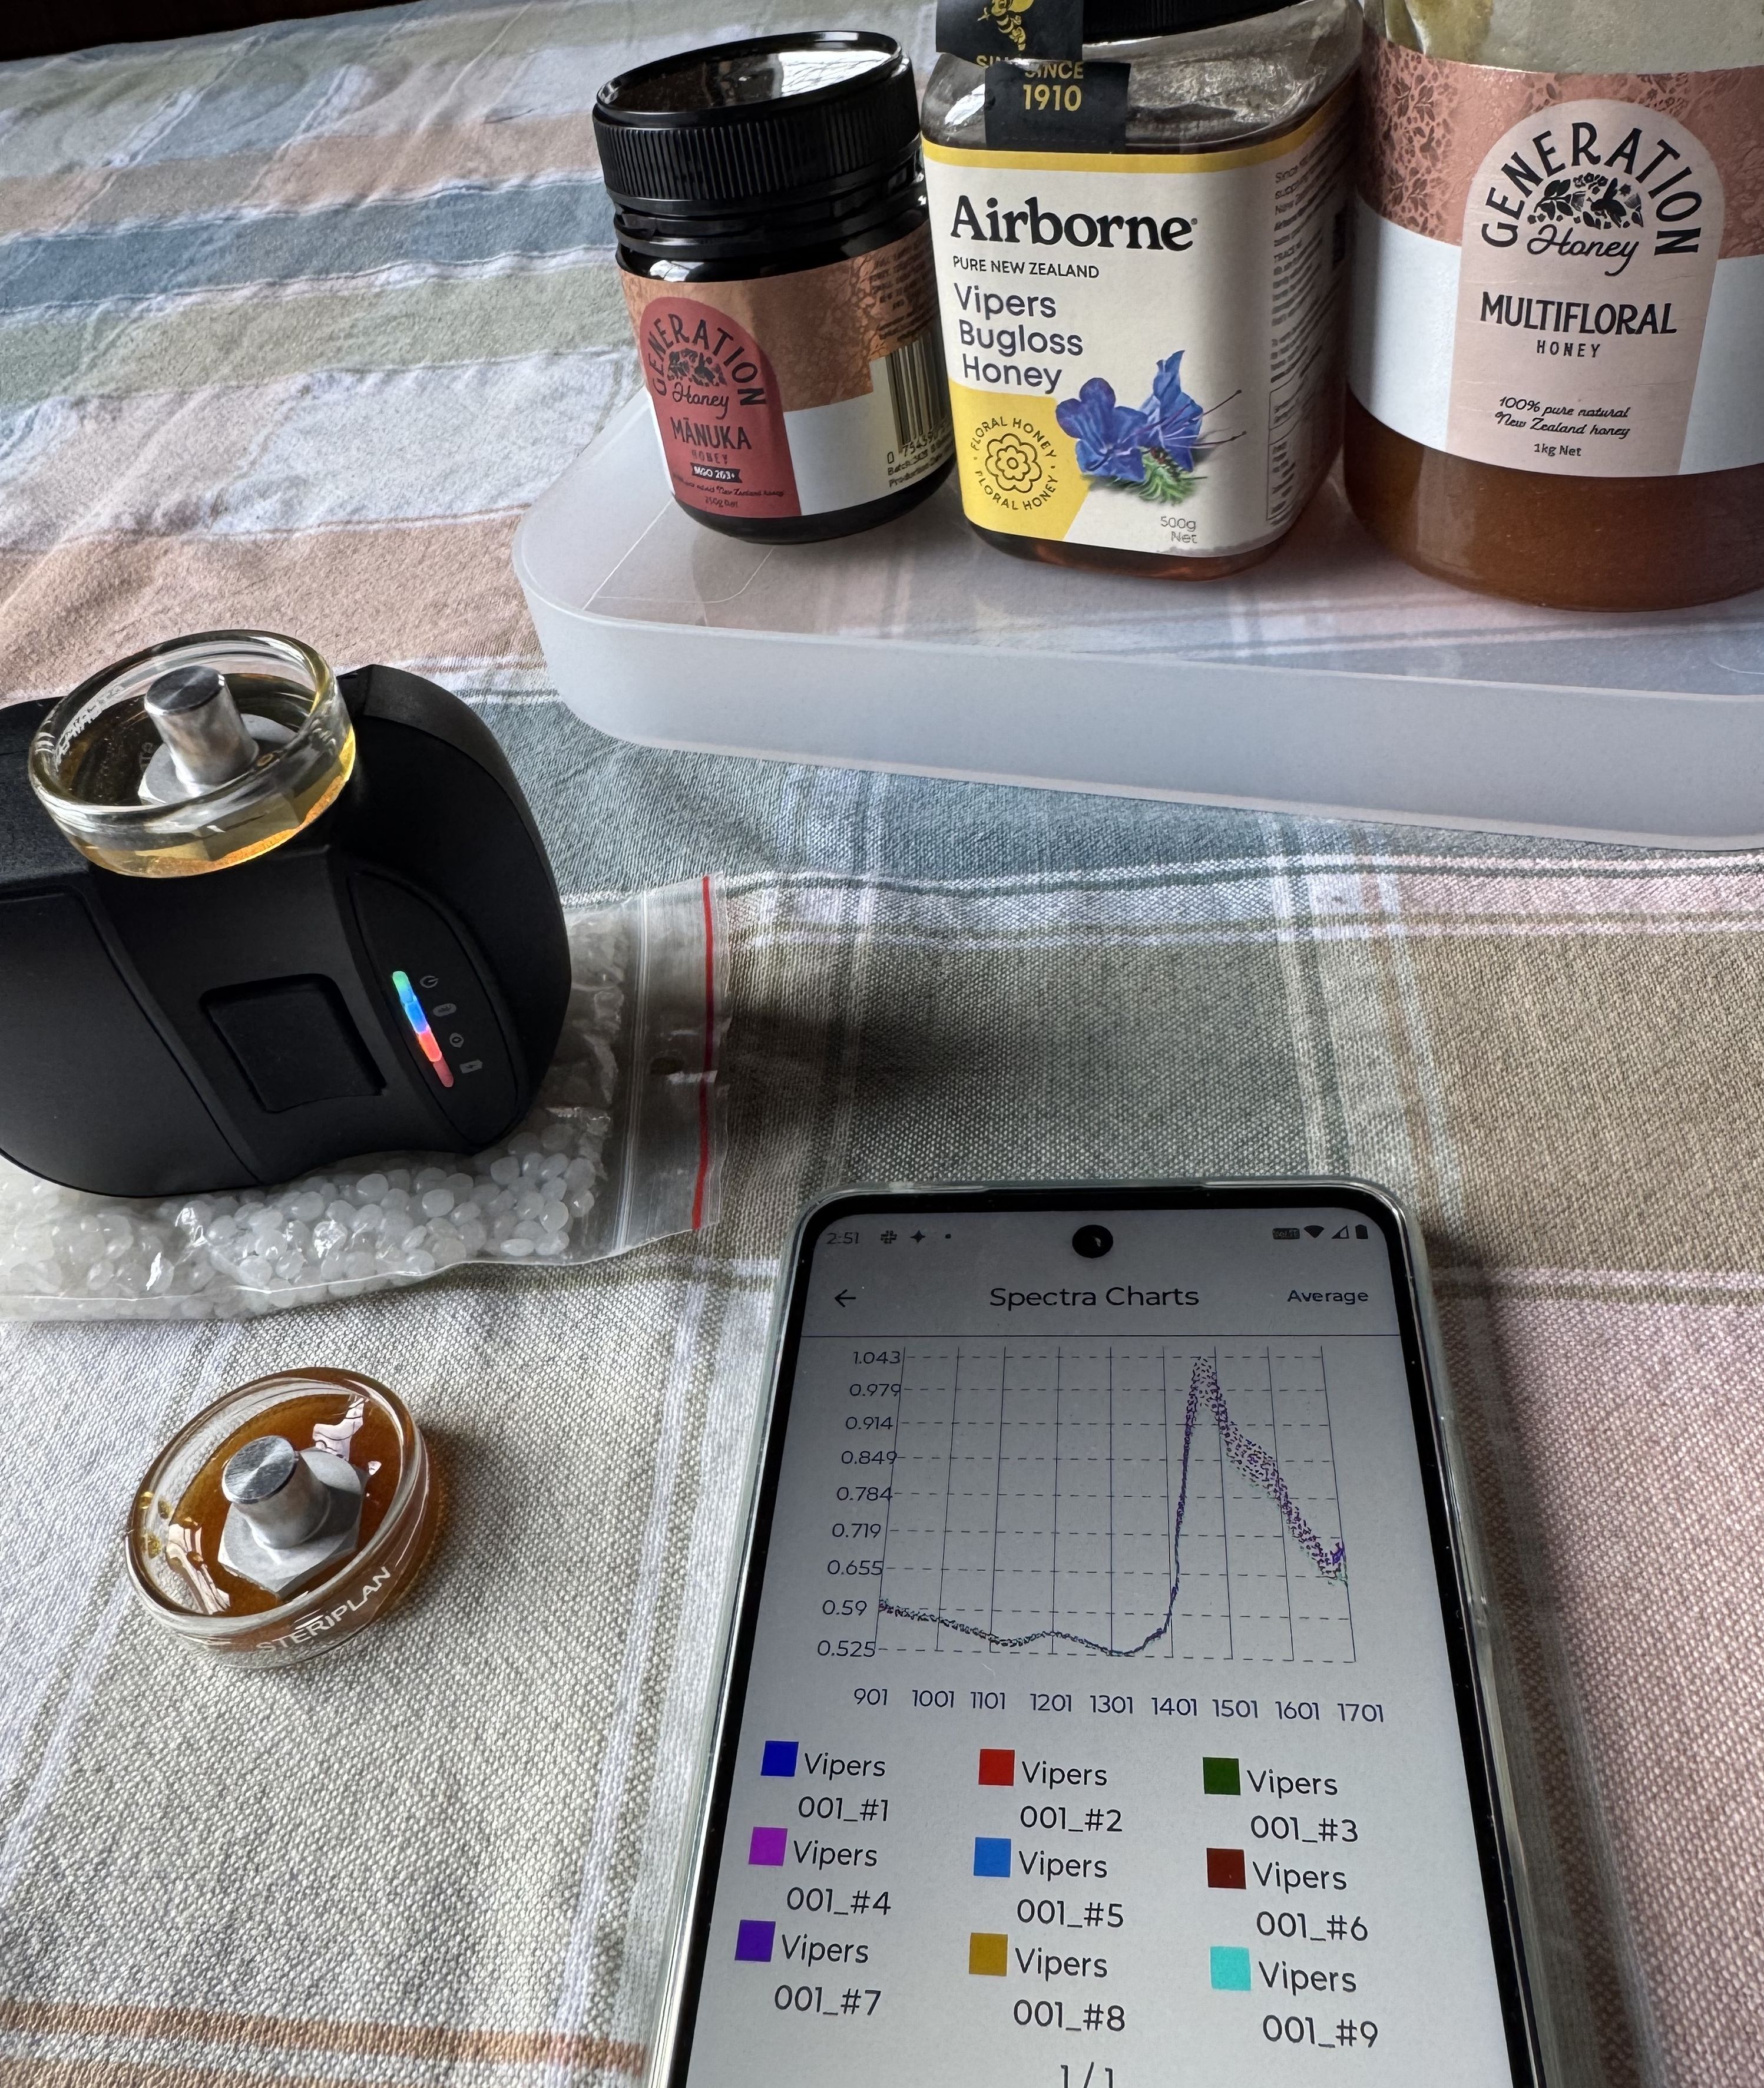
We decided to see whether miniature NIR spectroscopy could be used detect honey adulteration. We obtained 12 New Zealand honey samples of known provenance, and scanned each with a Sagitto NIR instrument to obtain its absorbance spectrum.

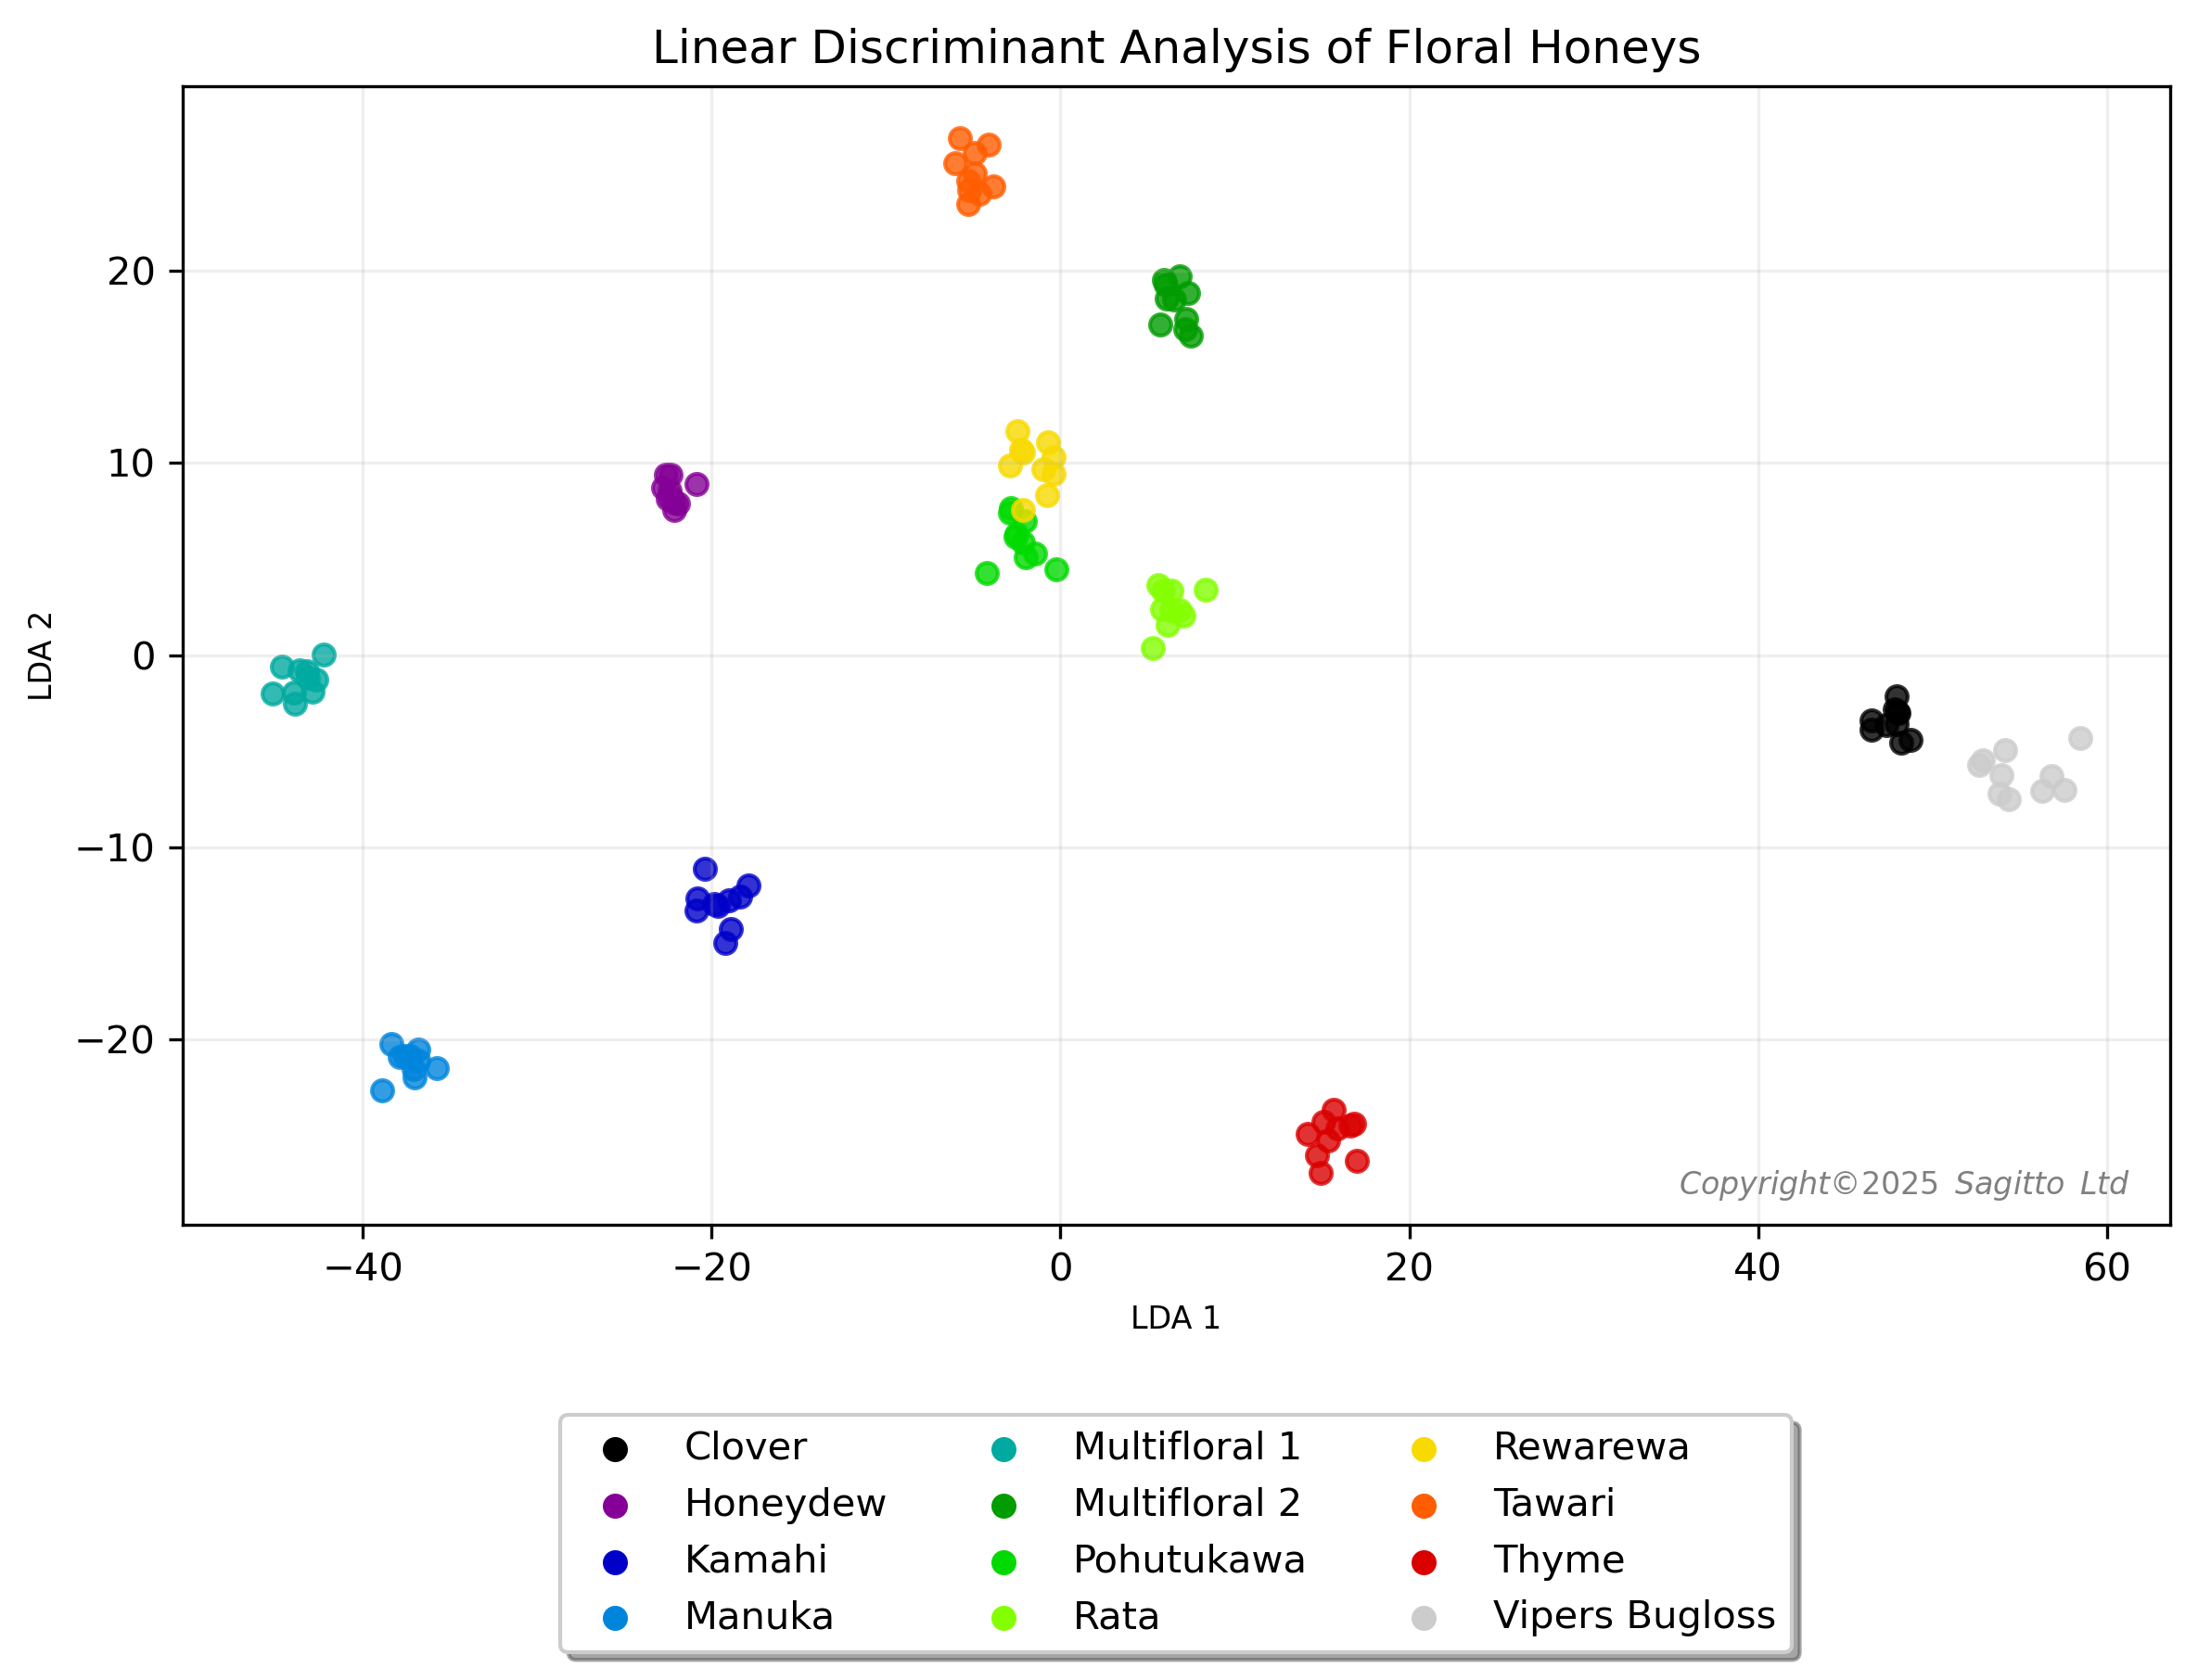
Linear discriminant analysis of the honey spectra indicated that they could be readily distinguished from one another using NIR spectroscopy
We purchased corn syrup and brown rice malt syrup from a local supermarket, and mixed varying quantities with approximately 15gm of individual honeys to emulate adulteration of honey with cheaper syrups.

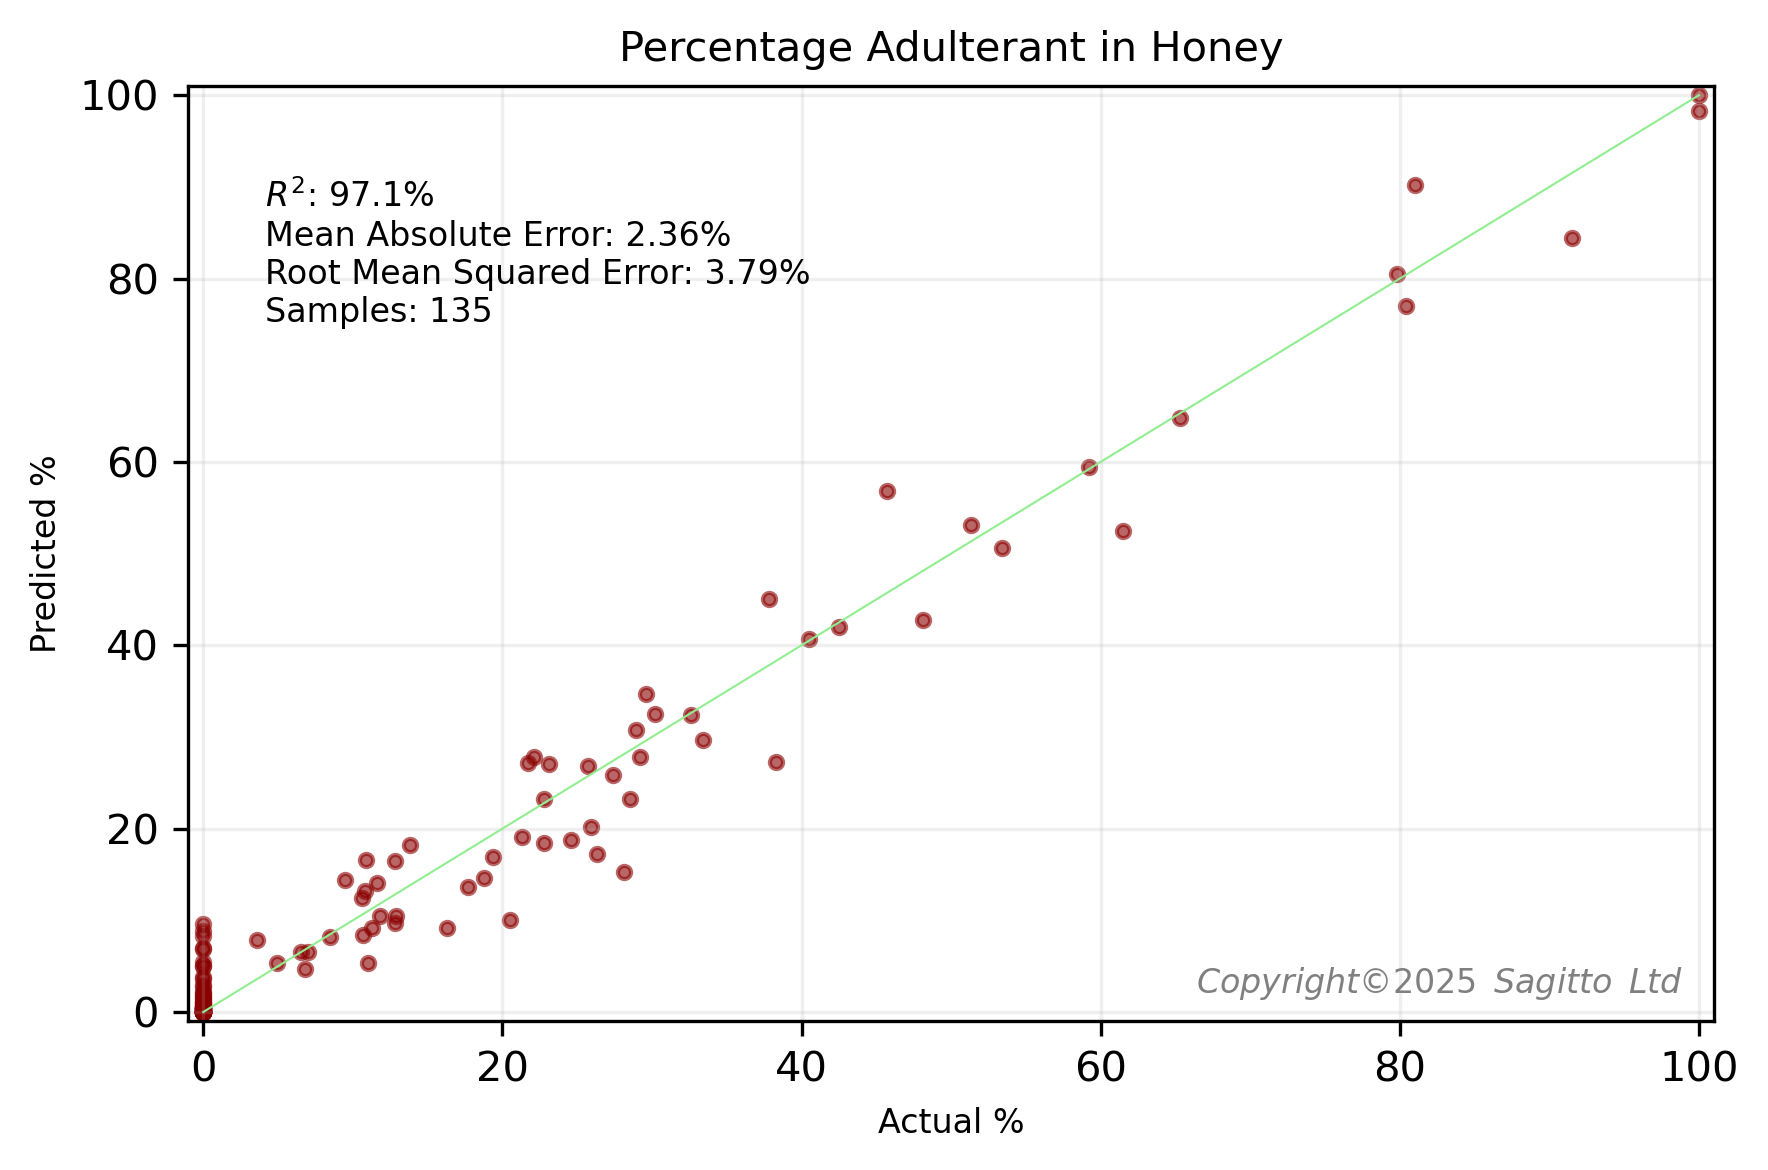
After scanning various mixtures of honey and syrup, we created two regression models - for clover honey adulterated with corn syrup, and multifloral honey adulterated with rice syrup.


These two regression models looked very promising. However when we generalised our model to include adulteration of other honeys, we noticed that the model tended to predict a small percentage of adulterant in other pure honeys.
A classification model, that sought to distinguish between pure and adulterated honeys, was very accurate. Almost* all adulterated honeys were correctly predicted, and all 12 pure honeys were correctly classed as unadulterated. Published research3,4,5 suggests that NIR can be effective for detecting moderate to high levels of adulteration. However, detecting adulteration at very low concentrations (e.g., below 10% w/w, as used in Sagitto's experiment) is recognized as a more significant challenge. Sagitto is proud to have shown that samples with as little as 3% adulterant can be detected by combination of miniature NIR and machine learning.
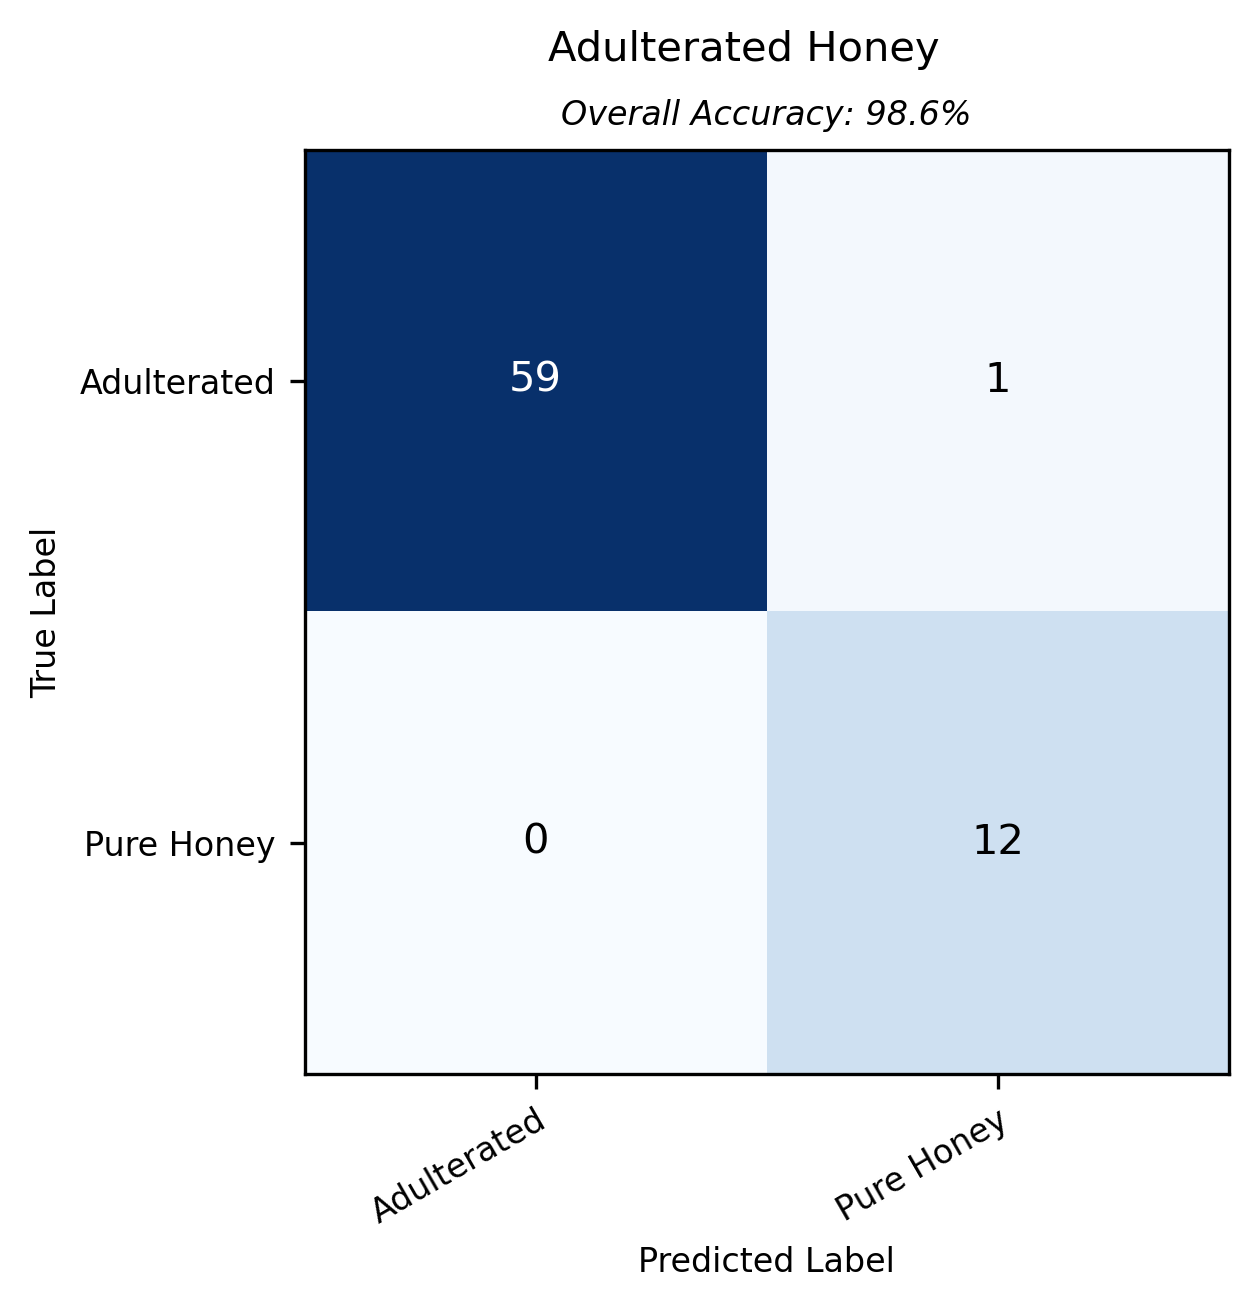
* The one misclassified was a multifloral honey adulterated with 6.5% of rice syrup
C4 Sugars Screening
The C4 sugar test for honey6 (also referred to as SIRA Stable Isotope Ratio Analysis) is a widely recognized method used to detect the adulteration of honey with cheaper sugar syrups, primarily those derived from C4 plants like sugarcane and maize (corn).
C3 vs. C4 Plants
Plants utilize different photosynthetic pathways to convert carbon dioxide into sugars.
- C3 plants: Most plants, including those that produce nectar for honeybees (e.g., flowers, trees), use the C3 photosynthetic pathway; and sugars from C3 plants have a lower ratio of Carbon-13 (13C) to Carbon−12 (12C) isotopes.
- C4 plants: Plants like sugarcane and corn (maize) use the C4 photosynthetic pathway. Sugars from C4 plants have a distinctly higher ratio of 13C to 12C isotopes
How It Works For Honey
The C4 sugar test analyzes the 13C to 12C ratio in both the whole honey and protein extracted from the same honey. In pure honey, the carbon isotope ratio of the whole honey should be very similar to the carbon isotope ratio of the protein (which comes from the bees and the nectar/pollen they collected). The protein serves as an internal reference, reflecting the natural diet of the bees.
If C4 sugars (like cane sugar or corn syrup) have been added, they will alter the overall carbon isotope ratio of the honey, making it more similar to C4 plant sugars. The difference in the isotope ratio between the whole honey and the honey protein will then be significantly greater.
Our Experiment
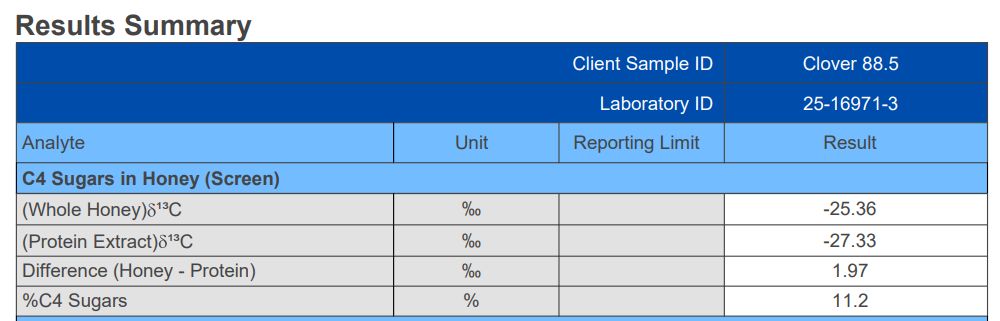
We made up two samples of honey : a sample of clover honey adulterated with 11.5% corn syrup; and a sample of clover honey adulterated with 11.8% rice syrup. Then we had a commercial laboratory run a C4 Sugars Screening test on both samples7,8.
The corn syrup adulteration was clearly identified
while the rice syrup adulteration was not detected
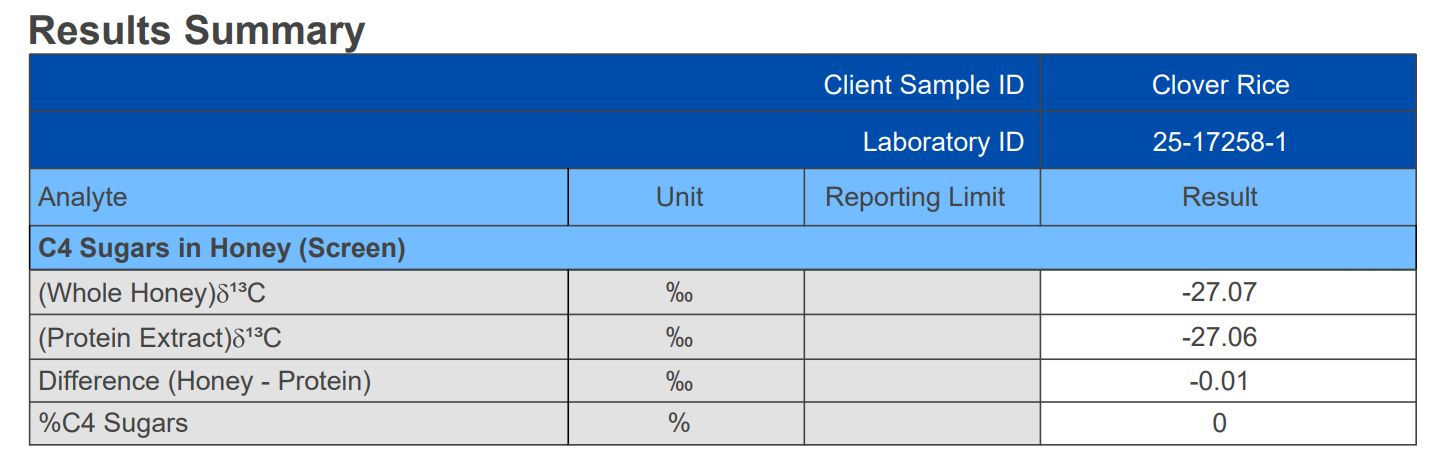
C4 Sugar Test Fails to Detect Rice Syrup Adulteration in Honey
The C4 sugars test for honey adulteration is ineffective at detecting the presence of rice syrup because both honey and rice syrup are derived from plants that utilize the same photosynthetic pathway. Rice (Oryza sativa) is a C3 plant, just like the nectar-producing flowers favoured by bees.
Consequently syrup produced from rice has a carbon isotope signature that is virtually indistinguishable from that of pure honey. This limitation highlights a significant loophole in honey quality control, allowing for the undetected adulteration of honey with C3 plant-based syrups such as rice or sugar beet syrup.
Raman Spectroscopy
Raman spectroscopy is a non-destructive analytical technique that provides detailed information about a material's chemical structure. Typically it involves illuminating a sample with a laser.9 When the laser light interacts with the molecules in the sample, most of it is scattered elastically - a phenomenon called Rayleigh scattering.
This scattered light has the exact same frequency as the incident laser light and carries no useful chemical information. However, an extremely small fraction of the light— in the order of one in ten million photons - is scattered inelastically. This is the Raman effect.
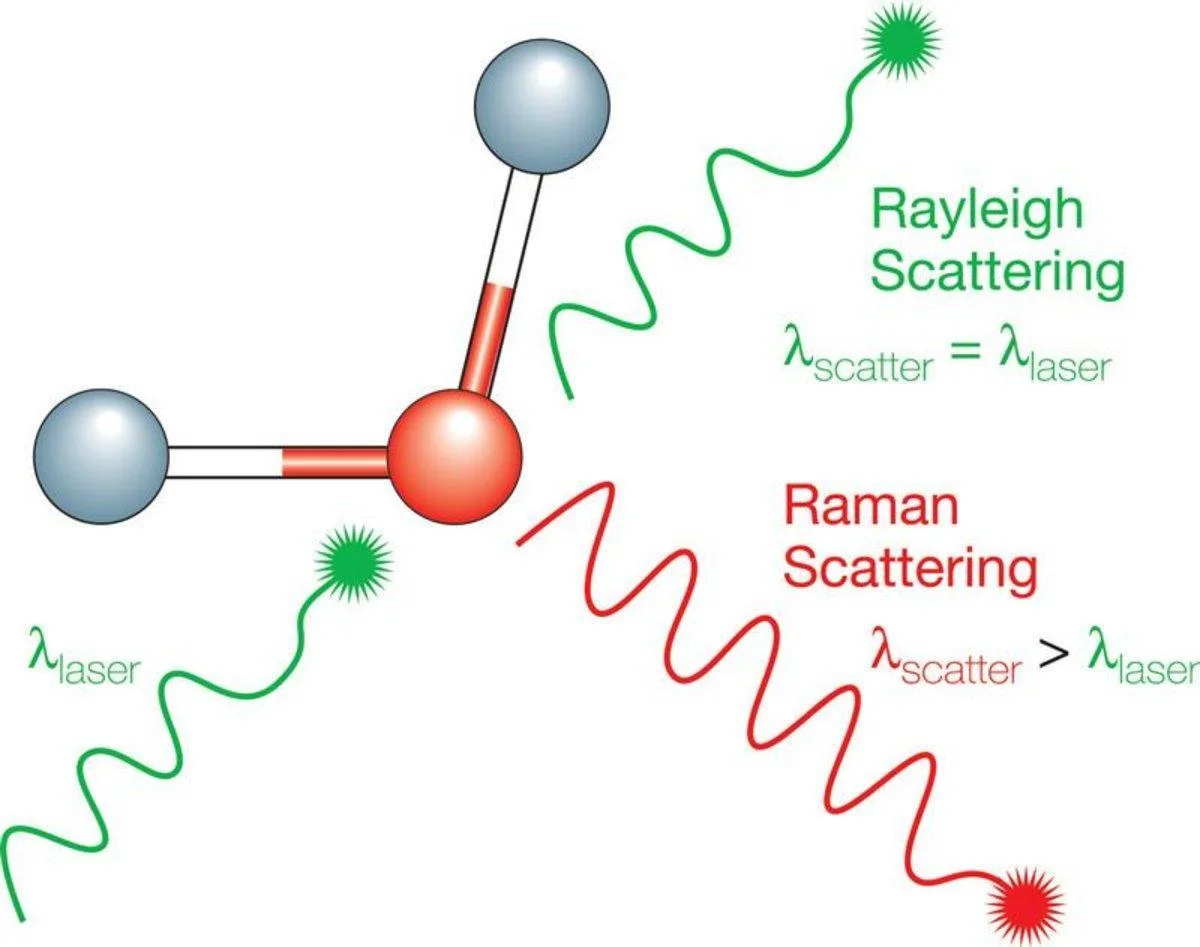
Inelastic scattering occurs when the laser photons exchange energy with the vibrational modes of the molecules. This energy exchange results in the scattered photon having a different frequency from the incident laser light.
The magnitude of this frequency shift corresponds directly to the vibrational energy of the molecular bond involved. By collecting this inelastically scattered light and plotting its intensity as a function of the frequency shift, a Raman spectrum is generated.
This spectrum consists of a series of sharp peaks, each corresponding to a specific molecular vibration within the sample. Because the vibrational structure of every molecule is unique, the resulting Raman spectrum serves as a highly specific and detailed "chemical fingerprint".
Spatial Offset Raman Spectroscopy (SORS)
Conventional Raman spectroscopy, while powerful, is fundamentally a surface-analysis technique. Its probing depth is typically limited to the first few hundred micrometers of the surface. This presents a major obstacle for the analysis of products within their packaging. A standard Raman measurement of a jar of honey would be overwhelmed by the signal from the glass or plastic container, completely obscuring the signal from the honey inside.
Spatial Offset Raman Spectroscopy (SORS) is a variant of Raman spectroscopy designed specifically to overcome this limitation. It enables the accurate chemical analysis of materials beneath obscuring surfaces.
While a conventional Raman measurement collects light from the same spot that is being illuminated, a SORS measurement collects light from a spot that is spatially offset by a few millimetres. The photons that manage to travel this lateral distance and emerge at the offset collection point have, on average, penetrated deeper into the sample before scattering back to the surface. Consequently, the spectrum collected at this offset position contains a much greater relative contribution from the subsurface layers (the honey) compared to the superficial layer (the container).
A Case Study
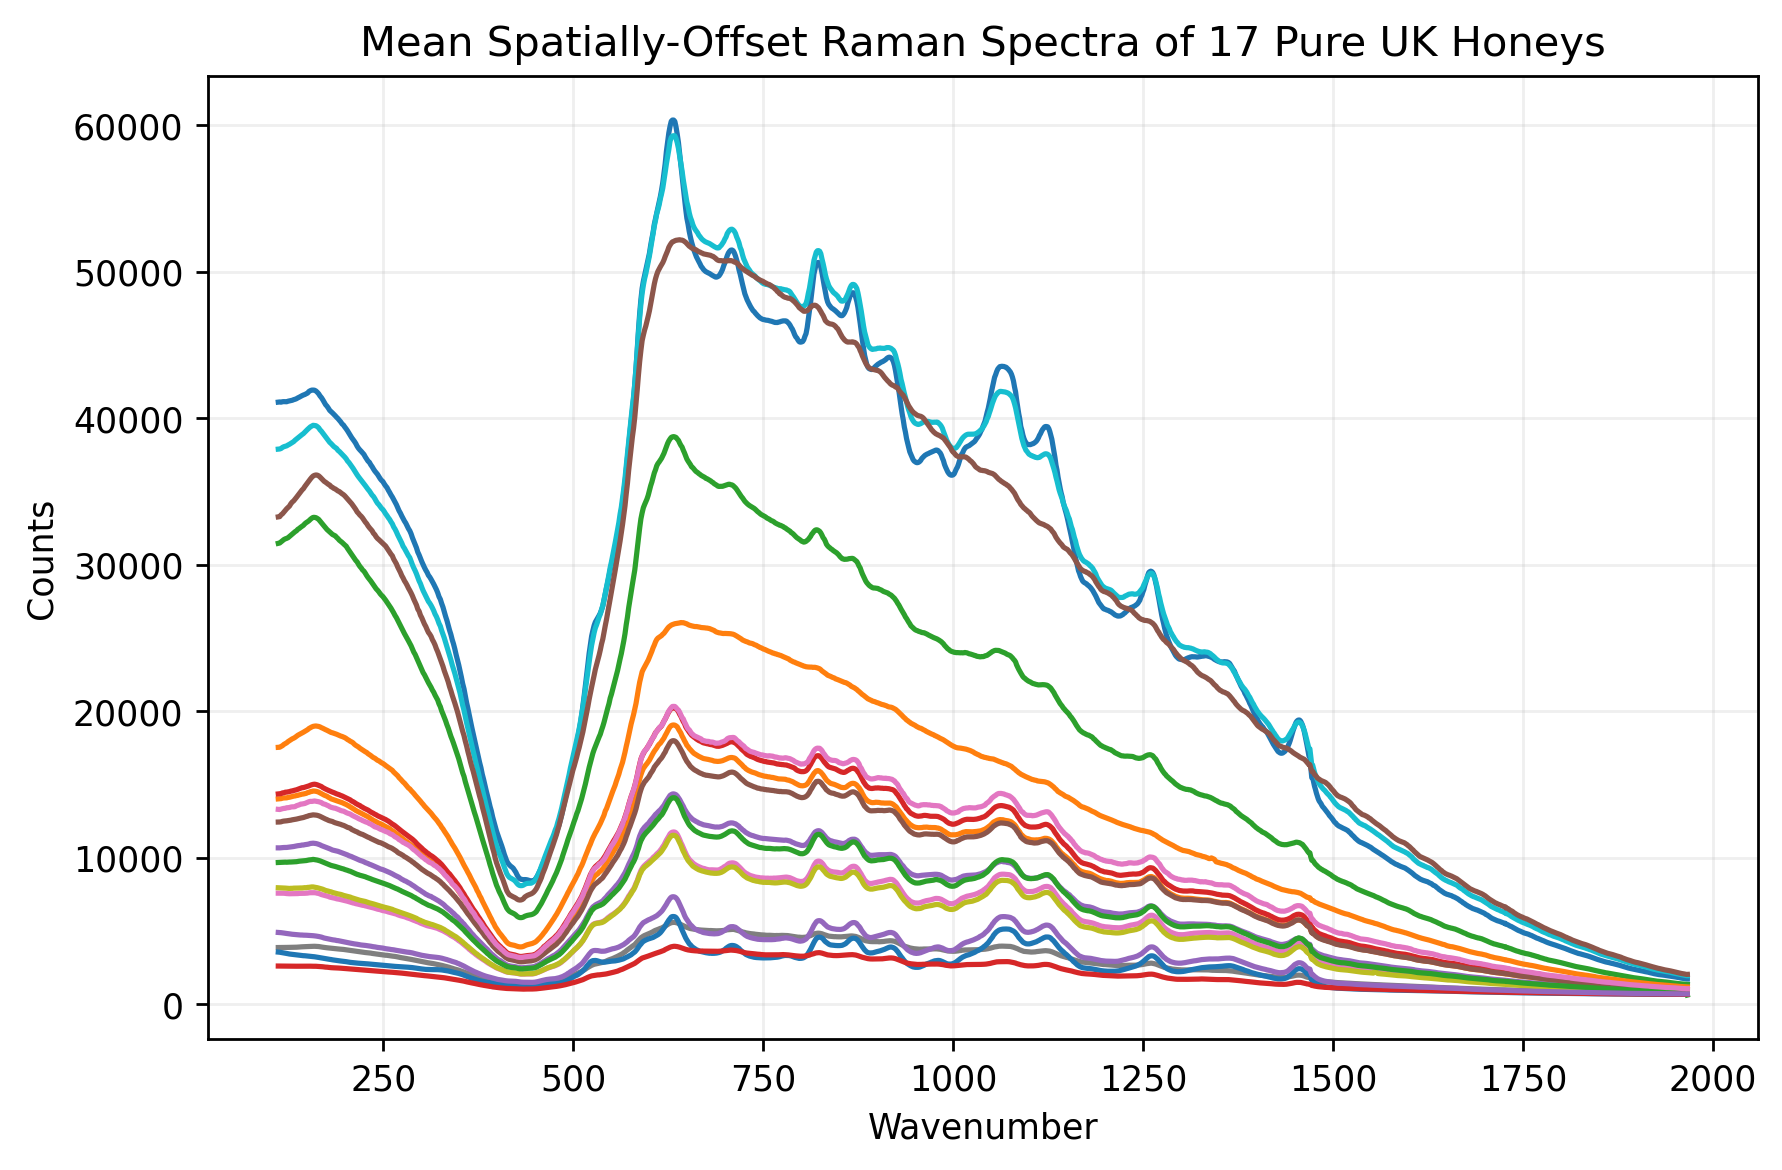
The potential value of SORS for the honey industry has been demonstrated by recent research12,14, particularly a collaboration between Cranfield University and the UK's Science and Technology Facilities Council (STFC) Central Laser Facility (CLF). In this study researchers used a custom-built SORS instrument to analyze 17 different types of authentic UK honey in 7ml Pico Glass vials, to emulate measurement through glass packaging.
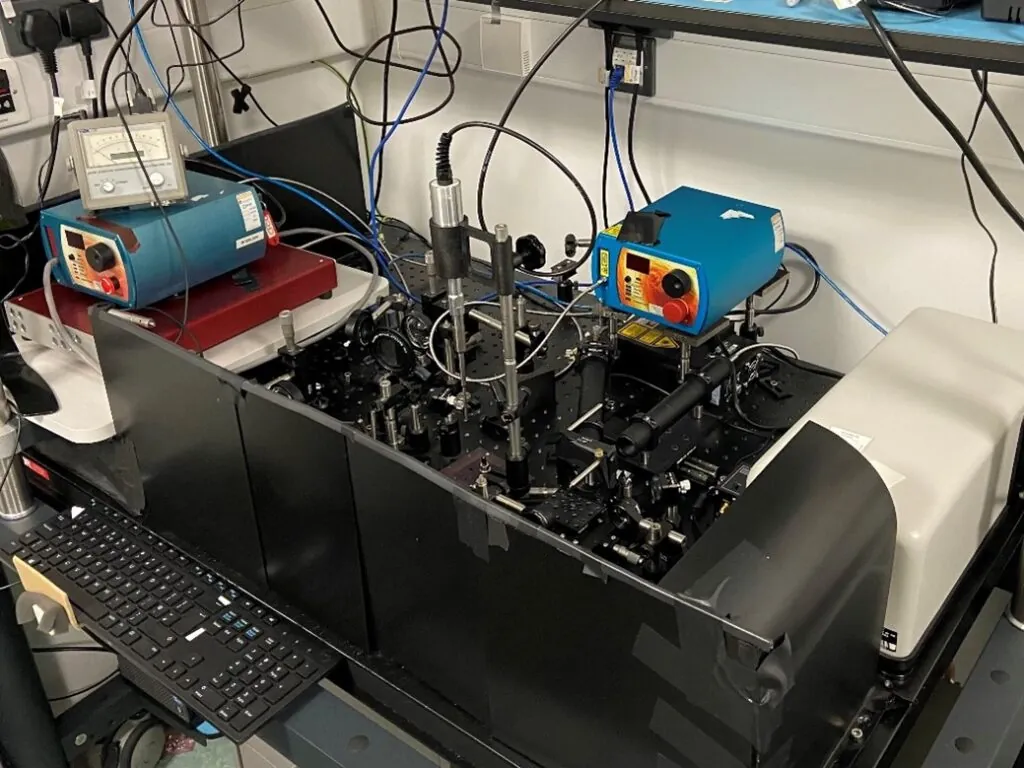
Image Source : Reference 13 below
To simulate fraud, these authentic samples were spiked with common C3 plant-based adulterants—rice syrup and sugar beet syrup—at various concentrations ranging from 10% to 50% by weight.
A common method for visualising spectral data is to conduct Principal Components Analysis (PCA). The researchers found that 14 of the 17 pure honeys forming a tight cluster in a PCA plot of pre-processed spectra, indicating similar biochemical profiles. Three dark honeys - buckwheat, ivy and heather - were positioned away from this cluster. The researchers chose to exclude these three honeys from their main analysis.
The Cranfield University researchers kindly published the data for this study. Using this data, Sagitto was able to create two regression models - one for 14 UK honeys adulterated with beet syrup, and one for those adulterated with rice syrup.
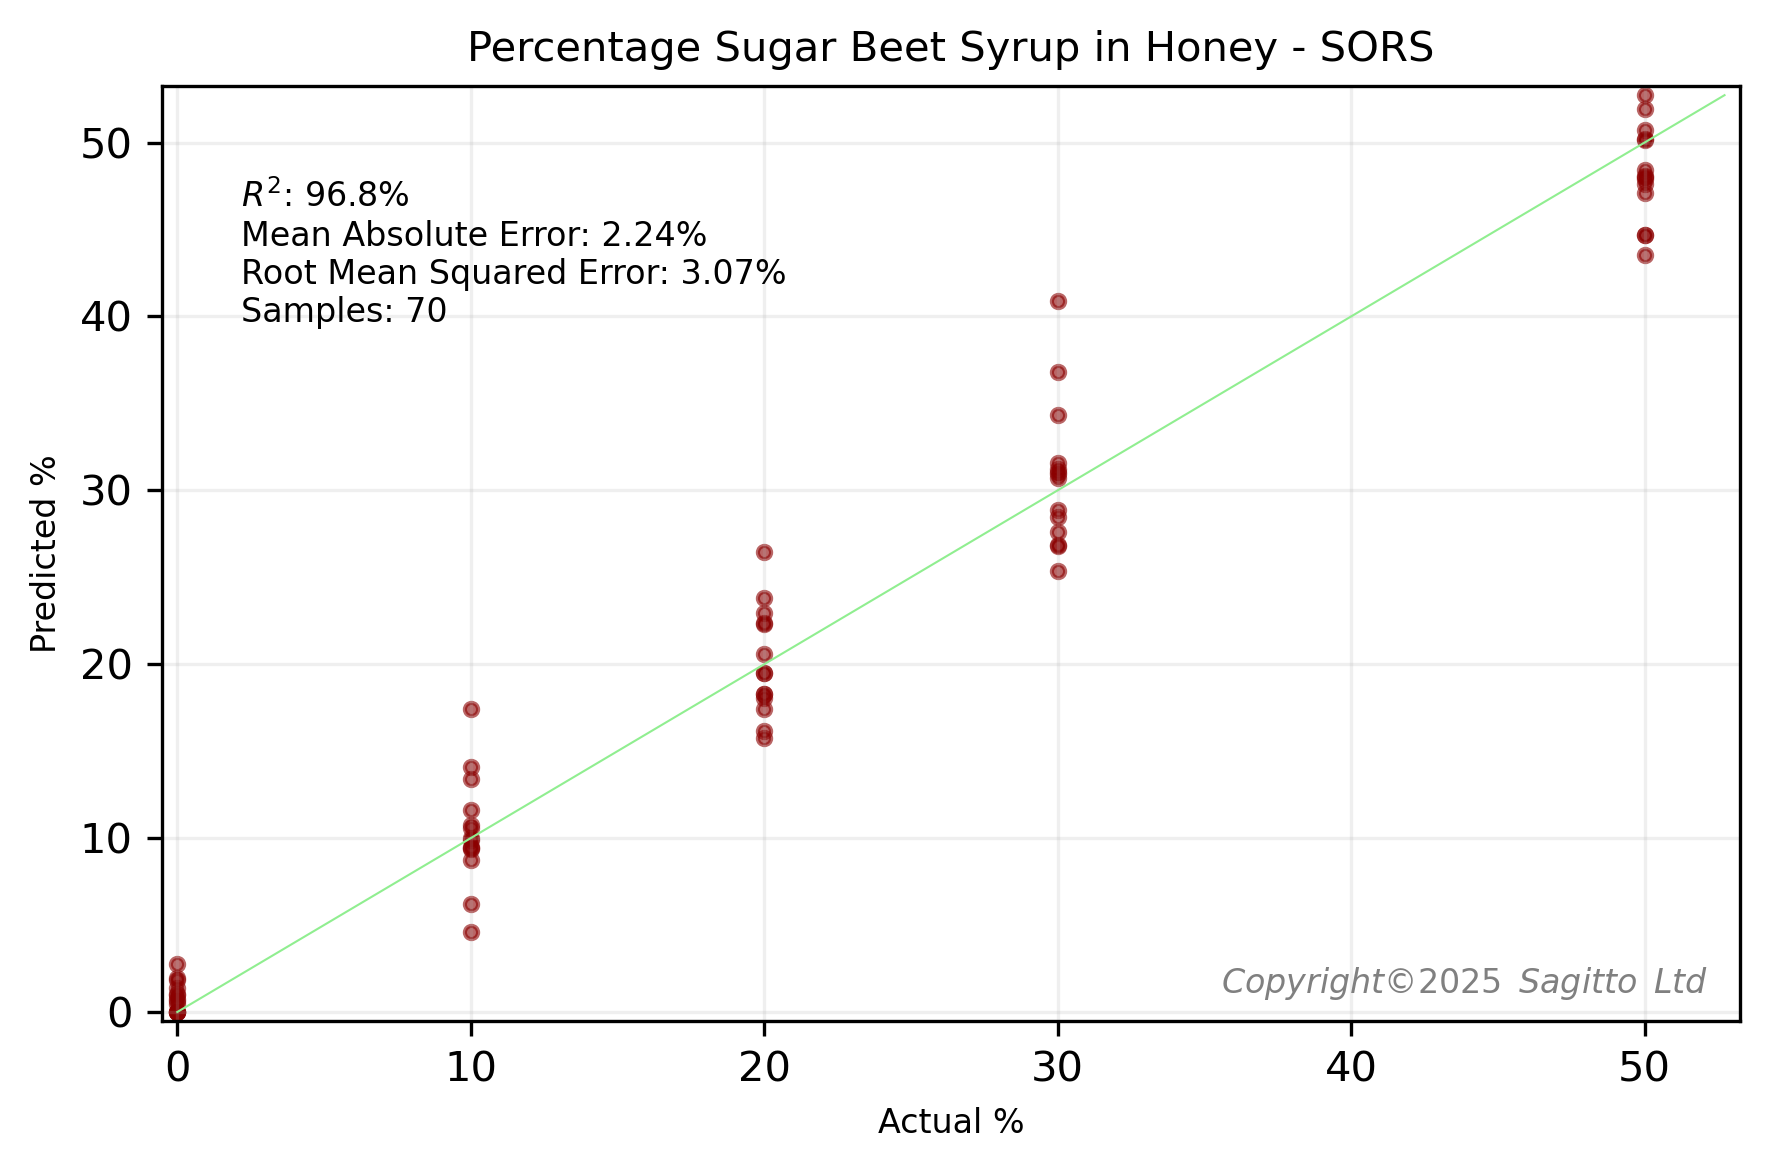
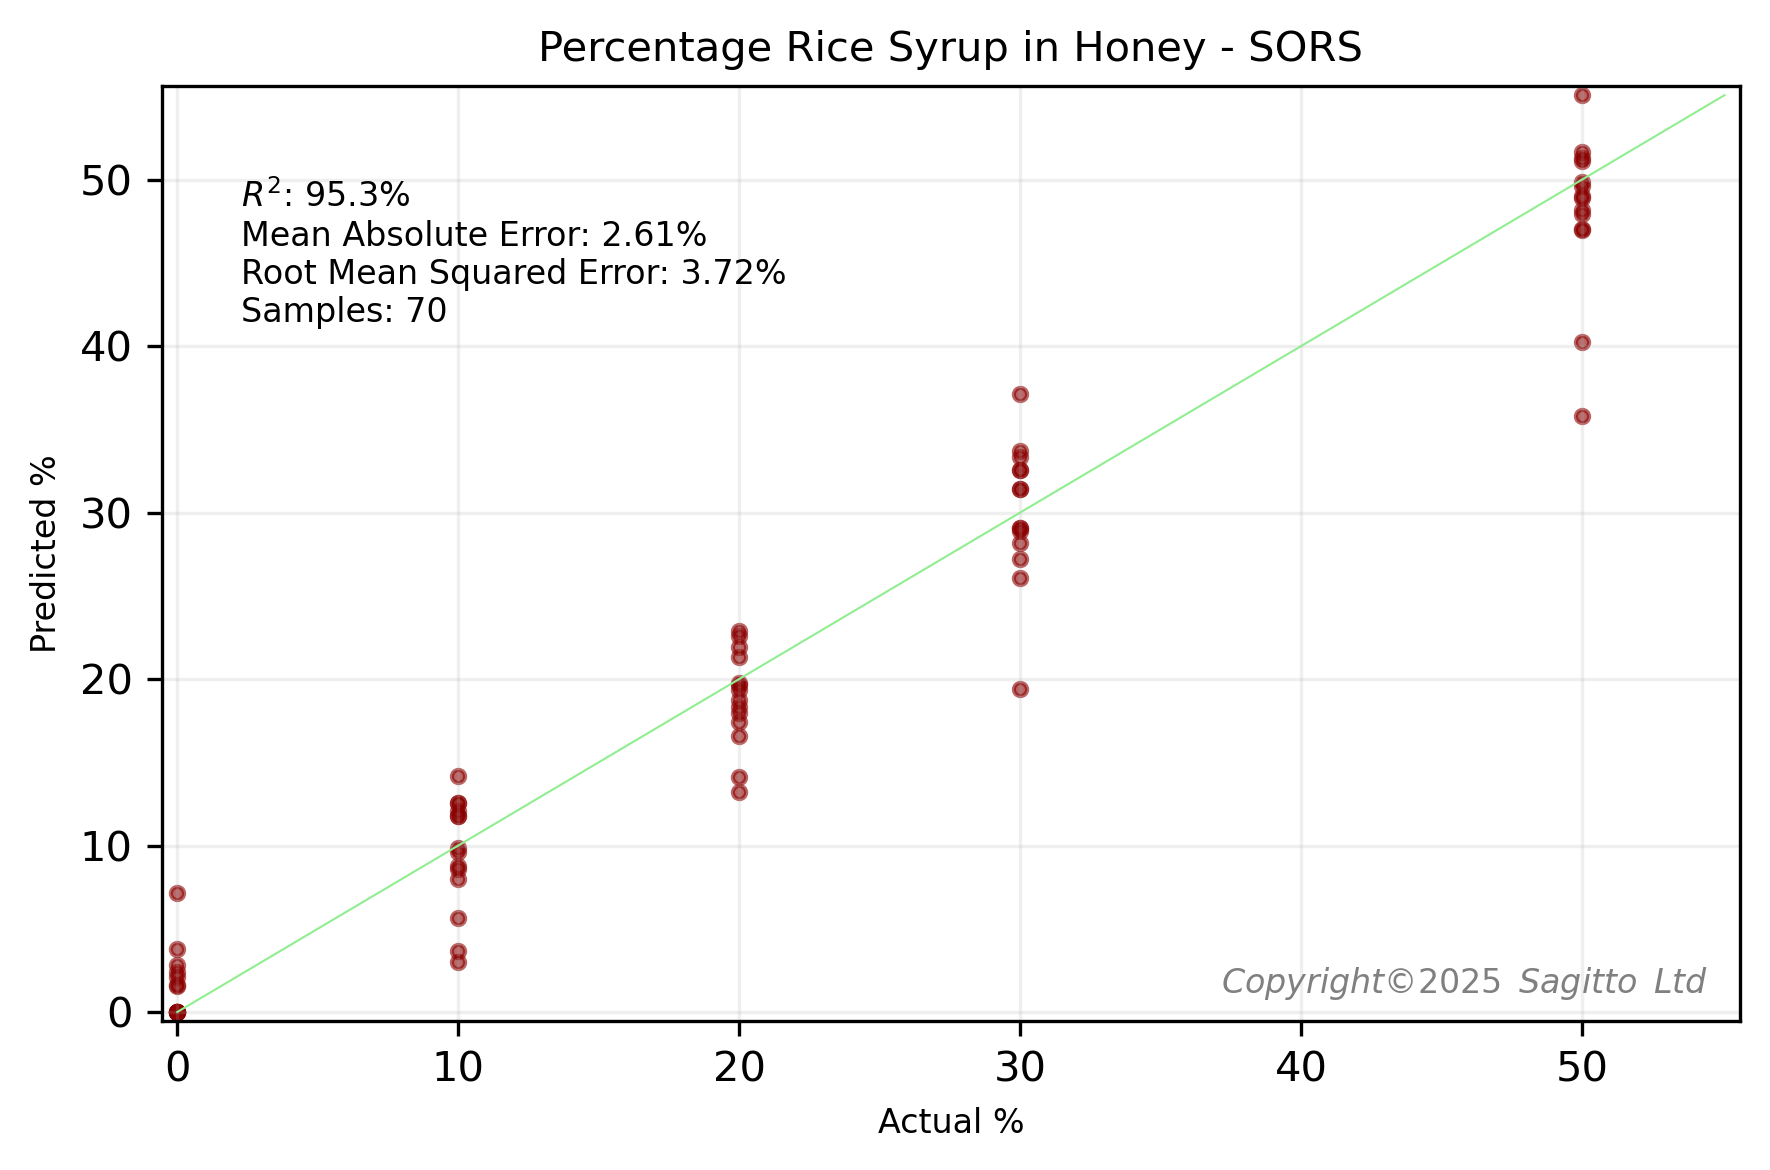
The above model performance results were calculated using leave-one-group-out cross validation. Using the same leave-two-groups-out cross-validation technique as the Cranfield University researchers, we found that our regression models compared favourably - especially for honeys adulterated with sugar beet.
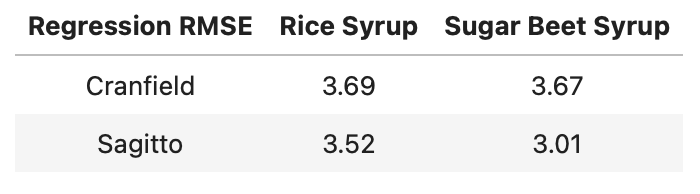
These regression models are better than those that we built using miniature NIR spectroscopy and 12 New Zealand honeys, where we achieved RMSE values of about 5%.
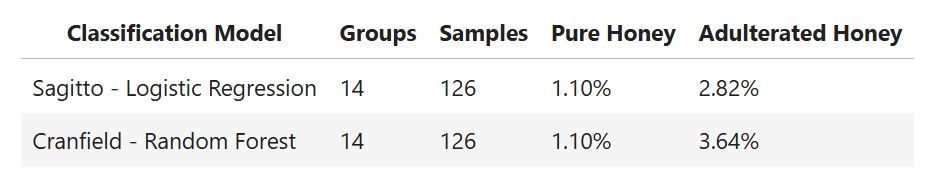
Out of curiosity, we also built a classification model using the Cranfield University SORS Raman data with the same leave-two-groups-out cross-validation technique. We found that Logistic Regression - when coupled with Sagitto's proprietary preprocessing - performed better than a Random Forest classifier.
Conclusions From SORS Raman Case Study
The Cranfield University study "successfully employed through-container SORS measurements coupled with machine learning predictive modelling to achieve non-invasive detection of exogenous sugar adulteration in UK honeys. Different levels of adulteration, between 10 and 60%, were employed to train various machine learning algorithms.... The syrups used for adulteration were rice, sugar beet, and sugar cane.... rice and sugar beet syrups derive from C3 plants, which are not easily detected with [stable isotope ratio analysis] methods."12
From a New Zealand Manuka honey perspective, a potential limitation of this study is that it mainly focused on light coloured honeys. "The 14 honeys in the main [PCA] cluster were all white—light—amber-coloured honeys, while the other 3 honeys (heather, ivy, and buckwheat) ranged between amber and a dark amber colour, resulting in higher intensity SORS signals as well as strong fluorescence interference."12
Fluorescence interference is a common challenge in Raman spectroscopy. Some compounds, when illuminated by the laser, can emit a broad fluorescence signal that is often many orders of magnitude stronger than the weak Raman scattering signal. This intense fluorescence background can completely mask the Raman fingerprint, rendering analysis impossible. Certain types of honey, depending on their floral origin and composition of minor compounds, are prone to fluorescence.
A recent paper14 published by Australian researchers showed that even dark coloured honeys such as Hill Gum, Tea Tree, and Mahogany could be successfully classified by floral type, using SORS. This supports the Cranfield University conclusion that a "SORS-based screening method could serve as a quick tool to differentiate between pure and 'suspicious' samples..."12
Nuclear Magnetic Resonance Spectroscopy (1H NMR) and Honey
¹H NMR spectroscopy, or proton NMR, exploits the magnetic properties of hydrogen nuclei (protons), which are abundant in the organic molecules that constitute honey. It is the basis of honey profiling services offered by companies such as Bruker BioSpin GmbH. An example report for manuka honey can be seen here.
The Core Principle of NMR: Nuclear Spins and Chemical Environments
Every proton possesses a quantum property called spin, which causes it to act like a tiny magnet.
- Magnetic Alignment: When a honey sample is placed inside the powerful magnetic field of an NMR spectrometer, these proton "magnets" align with the external field.
- Radiofrequency Pulse: The sample is then irradiated with a short, precise pulse of radio waves. This pulse provides the energy to knock the protons out of alignment.
- Signal Detection: As the protons "relax" back to their aligned state, they emit energy in the form of radio signals. The specific frequency of the signal emitted by each proton is detected.
The crucial point is that the exact frequency of this signal is minutely altered by the proton's local chemical environment. A proton attached to a glucose molecule is shielded by a different cloud of electrons than a proton on a formic acid molecule. This difference in shielding causes a change in the emitted frequency, a phenomenon known as the chemical shift.
Decoding the NMR Spectrum
The output from an NMR experiment is a spectrum that plots signal intensity against chemical shift. This spectrum provides three key pieces of information:
- Chemical Shift (Peak Position): The position of a signal on the x-axis indicates the type of molecule the proton belongs to. For example, the signals for anomeric protons on sugars like glucose and fructose appear in a characteristic region.
- Signal Integration (Peak Area): The area under each peak is directly proportional to the number of protons contributing to that signal. This is what makes NMR a highly quantitative technique. By integrating the signals one can determine the precise fructose-to-glucose ratio, for example.
- Signal Multiplicity (Peak Splitting): The interaction between adjacent protons causes signals to split into multiple lines . This splitting pattern provides detailed structural information about the molecule, confirming the identity of specific compounds.
A single honey spectrum contains thousands of data points from hundreds of different compounds, creating a highly complex and overlapping signal. The entire NMR spectrum is treated as a single, high-dimensional data vector. This data is then compared against a large reference database of authentic honey samples using multivariate statistical models.
Researchers and commercial entities have compiled extensive databases, but these are often proprietary. A prominent player in this field is Bruker, a manufacturer of scientific instruments, which has developed the "Honey-Profiling™" database. This boasts over 28,500 reference samples from more than 50 countries.
There is no doubt the high-resolution proton NMR is a very powerful and effective technique for identifying adulteration of honey with exogenous sugars. However it is also expensive, costing US$250 or more per honey sample. For that reason a combination of screening techniques like NIR or SORS, followed by confirmation testing of suspicious samples by 1H-NMR, would seem preferable.
Conclusion
In this brief over-view we have covered four methods for testing the authenticity of honey. These have ranged from miniature NIR instruments costing US$2,500 to super-conducting high-resolution NMR instruments costing over US$1m. Sagitto has the expertise and experience to work with data from all these instruments.
Acknowledgements
Almost all the New Zealand honey used in this study was from two reputable and long-established family companies - Generation Honey and Airborne Honey. This table lists these honeys, together with their Brix and colour measurements. And big thank you to Maria Anastasiadi and her team at Cranfield, for taking the rare and welcome step of publishing the data underlying their paper.
References
- EU Coordinated action to deter certain fraudulent practices in the honey sector
- Unpublished research conducted with the assistance of the brilliant Christopher Beckham, in conjunction with the University of Waikato and Analytica Laboratories Ltd
- Detection of Honey Adulteration Using FT-NIR Spectroscopy
- Portable NIR Spectroscopy to Simultaneously Trace Honey Botanical and Geographical Origins and Detect Syrup Adulteration
- Detection of Low-Level Adulteration of Hungarian Honey Using near Infrared Spectroscopy
- C4 Sugars Screening Test
- Certificate of Analysis : C4 Sugars Screening test for clover honey adulterated with corn syrup
- Certificate of Analysis : C4 Sugars Screening test for clover honey adulterated with rice syrup
- Guide to Raman Spectroscopy
- What Is Raman Spectroscopy
- Honey Differentiation Using Infrared and Raman Spectroscopy Analysis and the Employment of Machine-Learning-Based Authentication Models
- Application of Spatial Offset Raman Spectroscopy (SORS) and Machine Learning for Sugar Syrup Adulteration Detection in UK Honey
- The bee’s knees: CLF’s quest to find fake honey
- Differentiation and classification of Australian single botanical origin honeys using spatially offset Raman spectroscopy
- Example NMR Honey Profiling Report